This summer, APRO released its first rent-to-own industry survey since 2011. The numbers provide new insights on a range of topics, including RTO company financials, operational procedures and human resource issues. The survey serves as a guide for APRO member companies to discover how their numbers compare with industry averages.
APRO’s survey also provides the most accurate numbers to make projections about the industry’s future, while also serving as a benchmark of where we’ve been. The data serves the industry in many ways, but the most effective use is in telling the rent-to-own story in financial terms—the information that matters most to state and federal legislators, the media and, of course, the financial and investment communities.
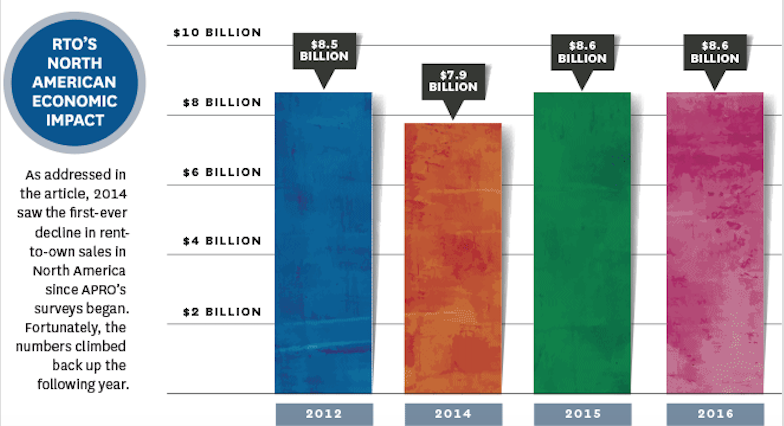
From a broad perspective—both when analyzing the new data and also comparing it to data from previous reports—the numbers indicate fairly small changes over the past few years. However, one development since APRO’s last survey—one that hasn’t happened before when comparing now to then—is that the RTO industry’s annual revenue dropped in 2014. That year, annual industry revenues for all of North America were $7.9 billion, down from the $8.5 billion estimate in the survey conducted in 2011. Fortunately, in 2015, revenue jumped back up to $8.6 billion and remained the same for 2016.
Click on image to see full size graphic.
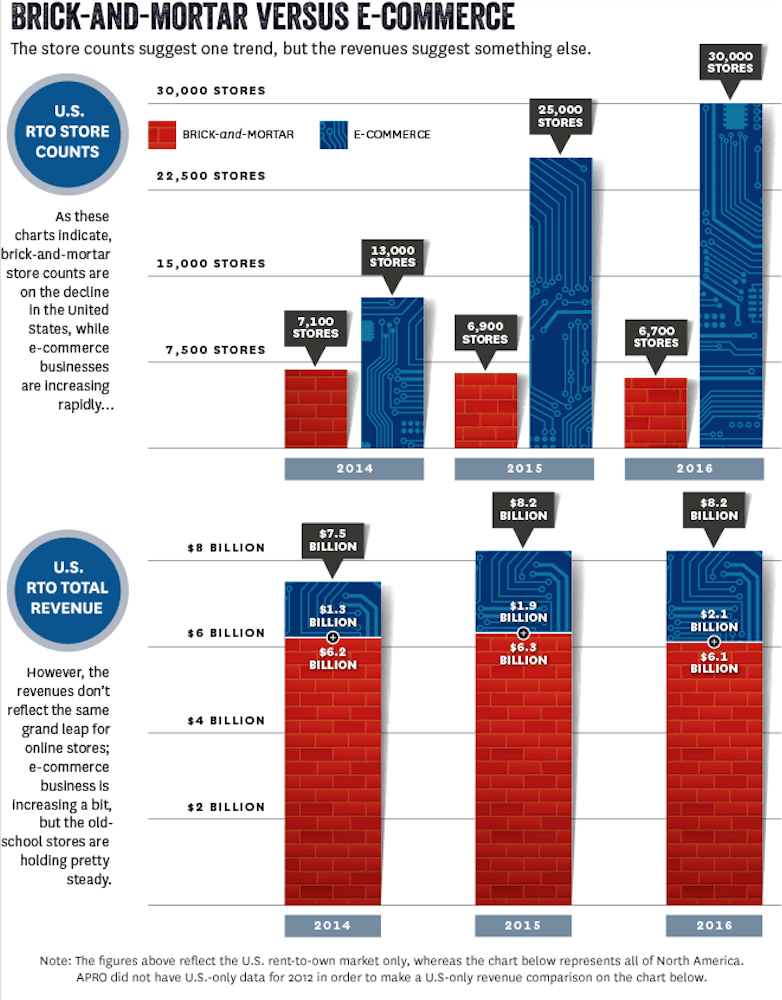
Perhaps most revealing in the new survey are the comparisons between brick-and-mortar stores and burgeoning e-commerce businesses. The latest numbers offer our first real opportunity to see how the two business models affect each other, and the RTO industry.
To get from a micro view to a macro view of the data, we took the average revenue per store per month and multiplied that by the number of stores in APRO’s database. The 2011 survey—the last time this data was collected—reflected an average of $63,000 per store per month. In 2014, the average revenue per store per month was $73,000, and the following year, it was $76,000. So, if individual store revenue rose steadily between 2010 and 2015, why the dip in the big-picture annual revenue in 2014? It comes down to store counts. Every year since 2011, U.S. brick-and-mortar store counts have declined. There were 7,100 rent-to-own stores in 2014, 6,900 in 2015 and 6,700 in 2016.
Since 2013, APRO has changed the way the data is analyzed. That’s the year the association started to differentiate between brick-and-mortar stores and internet/e-commerce businesses. The influx of e-commerce companies—and the many conversations with APRO members who are feeling the heat of new competition—made the distinctions crucial in analyzing RTO economic data.
As such, analyzing the recent survey provides a more interesting and accurate story. Brick-and-mortar stores suffered a small decline, $100 million, between 2014 to 2016. During that same period, e-commerce revenue shot up $800 million—and that only factors in e-commerce data generated from publicly traded companies.
In APRO’s database, there are 40 rent-to-own e-commerce companies listed. To project our macro trends for e-commerce, the three public companies gauged are Progressive, RAC Acceptance and Flex Shopper. While this data will not earn APRO a Pulitzer Prize in Economics, it does provide solid insights into industry trends.
The public e-commerce companies are waging an aggressive campaign in upping the store counts where the rent-to-own transaction is offered. According to annual reports from the three e-commerce companies, the number of stores increased by 17,000 in the past three years, which reflects an $800 million increase in revenue. But while the number of rent-to-own e-commerce stores is exploding, the revenue for those concerns is not matching proportionally. Not even close.
Another interesting revelation in the new survey is the customer count. Ignoring e-commerce and focusing only on U.S. brick-and-mortar stores for a moment, the customer count for 2016 was 3.4 million, which matches 2007 and 2008 numbers, but that’s 700,000 fewer customers than in 2011, which came to 4.1 million. Calculating a total customer count and store count for e-commerce is difficult. Progressive is the only company to offer such data, reporting more than 500,000 customers per year. That would increase the total 2016 customer count—brick-and-mortar plus e-commerce—to around 4 million, and that doesn’t factor in RAC Acceptance, Flex Shopper or the many other e-commerce companies.
In a nutshell, then, the trend is an increase in store count and revenue for RTO’s e-commerce segment and a decrease in store and customer count for brick-and-mortar stores—yet, the data reveals an increase in revenue with each store. Confused yet?
There are many other interesting findings in the latest survey, especially when compared to other APRO surveys of the past. Customer demographics, for example, are certainly shifting. The latest survey showed an RTO customer base of 45 percent Caucasian, 32 percent African American and 20 percent Hispanic—where family income is less than $50,000 a year. Ten years ago, it was 84 percent Caucasian and 15 percent African American. These demographic shifts in race roughly correspond with the overall demographics for Americans over the past decade.
Recent APRO surveys that focused exclusively on the Hispanic market reveal a great deal of potential for that segment to become loyal rent-to-own customers. These findings in 2015 were so impressive that APRO commissioned a follow-up customer survey last year to pinpoint the best ways to recruit and keep the Hispanic customer.
With the surge of Hispanic RTO customers and the potential for a much higher number, what does the survey reveal about how the RTO industry is addressing this market? On average, a mere 10 percent of the marketing budget targets the Hispanic demographic, most of which is spent on direct mail (58 percent) and radio (31 percent). These findings do not align with APRO’s recent surveys on the best way to market and communicate effectively to the Hispanic customer base. Last year’s Hispanic market survey revealed that television commercials—not direct mail or radio—are the most effective way to reach the Hispanic customer. According to APRO’s latest statistical survey, no money is designated exclusively to attracting the Latino base through television advertising. ¡Esa es una preocupación que debe arreglarse! Last year’s study suggests that Hispanics do not open much of their mail, even though a majority of RTO-industry advertising is “accomplished” via direct mail, flyers and postcards, according to this year’s survey.
Thirty-nine percent of rent-to-own companies surveyed indicate that they include the Spanish language in their marketing and advertising. Most Hispanics trust employees and stores with Spanish-speaking staff members, and one-third of respondents in this year’s survey indicate having Spanish-speaking employees in their stores. “That is a good sign, given the fact that Hispanic customers account for 20 percent of the customer base,” according to Greg Manns of Industry Insights.
Click on image to see full size graphic.
APRO’s RTO industry survey was released at Fuse 2017 in Galveston, creating a stir of conversation throughout the event. The numbers pretty much speak for themselves, but the industry trends they suggest are what have many rental dealers scratching their heads. In conversations at the bar in Galveston, figuring out why the numbers are what they are brought a range of speculation—from bad, outdated management execution to factors outside of the control of RTO businesses. These external factors include the e-commerce phenomenon, which is causing considerable market disruption within the industry. Others speculate that these declines are just a part of the ebb and flow of the rent-to-own market, and that it’s been shifting around for decades. Then there’s the observation that consumers have less disposable income than they used to have and/or that the job market is uncertain—that these factors are playing a part in a consumer’s hesitancy to rent a new couch. Yet, unemployment is really low and many economists rate the current economy as healthy. So, who knows?
It might be impossible to pinpoint precisely why the numbers are what they are, but the figures themselves provide a blunt reality: 2014 saw the first decline in yearly RTO revenue ever in North America and 2016 marked a decline in brick-and-mortar store revenue. APRO’s recent survey adds a lot of fuel to the fire when searching for answers that explain the current state of rent-to-own. We certainly will continue to try and get to the bottom of it all. But until all is revealed and the industry has reversed any declines—and figured out how to compete in an e-commerce economy—it’s best to familiarize yourself with the survey results. After all, information is power!
The latest survey results are available to APRO members only. For more information or to receive a copy of the survey, contact APRO Deputy Executive Director Richard May at rmay@rtohq.org, 800/204-2776, ext. 104.Click here to read the original article from RTOHQ: The Magazine in digital form.
Mike Lewis is a Premier Rental Purchase franchisee with multiple stores and currently serves as Vice President of Operations. With 33 years of experience in the rent-to-own industry, he has spent the past 20 years working closely with franchisee owners and previously spent 12 years in Corporate RTO, gaining a strong foundation in the business.
For the past five years, Mike has been sharing his knowledge by teaching managers and franchisees at the company’s Training Center.
Outside of work, he enjoys time with his family, kids, and grandkids, and appreciates the simple things in life – especially riding his Harley Davidson with the sun on his face. If you know, you know!
Lauren Talicska
Arona Corporation dba Arona Home Essentials
Lauren Talicska is an experienced multi-channel marketing specialist and the Vice President of Marketing & Communications at Arona Home Essentials. She has found her home in the RTO community, supporting stores in branding, growth, and increasing traffic.
You may recognize Lauren as a former RTO vendor, including her time as a partner for Nationwide RentDirect, or her previous participation in the APRO Vendor Advisory Committee. Lauren calls Columbus, Ohio, home and spends her workday crafting and executing marketing promotions from inception to realization, all while supporting the branding and social media needs of all the Arona stores in 12 states (plus Puerto Rico!).
Charles Smitherman
APRO
Charles Smitherman, JD, PhD, CAE, became CEO of APRO in 2023, bringing years of legal and executive experience in the rent-to-own industry.
Prior to joining the association, Charles served as COO, General Counsel, and Vice President of PTS Financial Services, where he played an active role in the rent-to-own industry by representing his company through PTS’s club program offering with APRO member dealers. Charles is an attorney with two decades of experience across a wide variety of areas, including RTO, consumer financial services, antitrust, corporate law, mergers and acquisitions, litigation, franchise law, and privacy law. Following law school at the University of Georgia, Charles earned a Master of Legal Studies and PhD in Law from the University of Oxford in England.
Charles is credentialed as a Certified Association Executive (CAE) with the American Society of Association Executives, a Certified Franchise Executive (CFE) with the International Franchise Association, and a Certified Information Privacy Professional (CIPP/US) and Certified Information Privacy Manager (CIPM) through the International Association of Privacy Professionals. As APRO’s sixth CEO in its 45-year history, he brings a collaborative, member-focused approach to association leadership, emphasizing transparency, advocacy, and value creation. Outside of work, Charles is an active ultra runner and open water swimmer.
Mike Kays
Ashley Furniture Industries
As VP of Rental Sales for Ashley Furniture Industries, Mike thrives on building relationships with our RTO industry veterans, and helping businesses grow through new product, new marketing, and new supply chain options.
Mike works to leverage a wide breadth of relationships and influence, intimate knowledge of market trends, and unique knowledge of what RTO dealers need from a supplier to be successful.
The saying goes that a high tide raises all boats, and our goal is to leverage the world’s largest furniture manufacturer to drive the continued growth of the RTO industry and all the suppliers.
Mike Tissot
Countryside Rentals Inc., dba Rent-2-Own
Mike grew up in the rent-to-own industry under the guidance of his father, former APRO President and RTO legend Darrell Tissot. For nearly 25 years, Mike’s innovative leadership has helped expand the family business to more than 40 stores across Ohio and Kentucky while also shaping the industry as a whole.
He has served as President of the Ohio Rental Dealers Association, an APRO board member and Treasurer, and President and Treasurer of the TRIB Group. His contributions have earned him the APRO President’s Award of Excellence and the title of APRO Rental Dealer of the Year.
Outside of RTO, Mike enjoys time at the lake house or in Orange Beach, Alabama, with his girlfriend, Angela Strong McCool. A passionate Cincinnati Reds fan, he rarely misses a game, whether watching or listening alongside his parents. He also takes every opportunity to visit Arizona, where his daughter is currently attending Arizona State University.

By APRO Deputy Executive Director Richard May